


Scipher.Vx+ helps manage renewable energy assets at scale, providing live monitoring, remote operations, and performance management for wind, solar PV, and battery storage assets from major OEMs.Offering a centralized user interface for streamlined fleet management, supporting various data sources and industry protocols.
Product Highlights
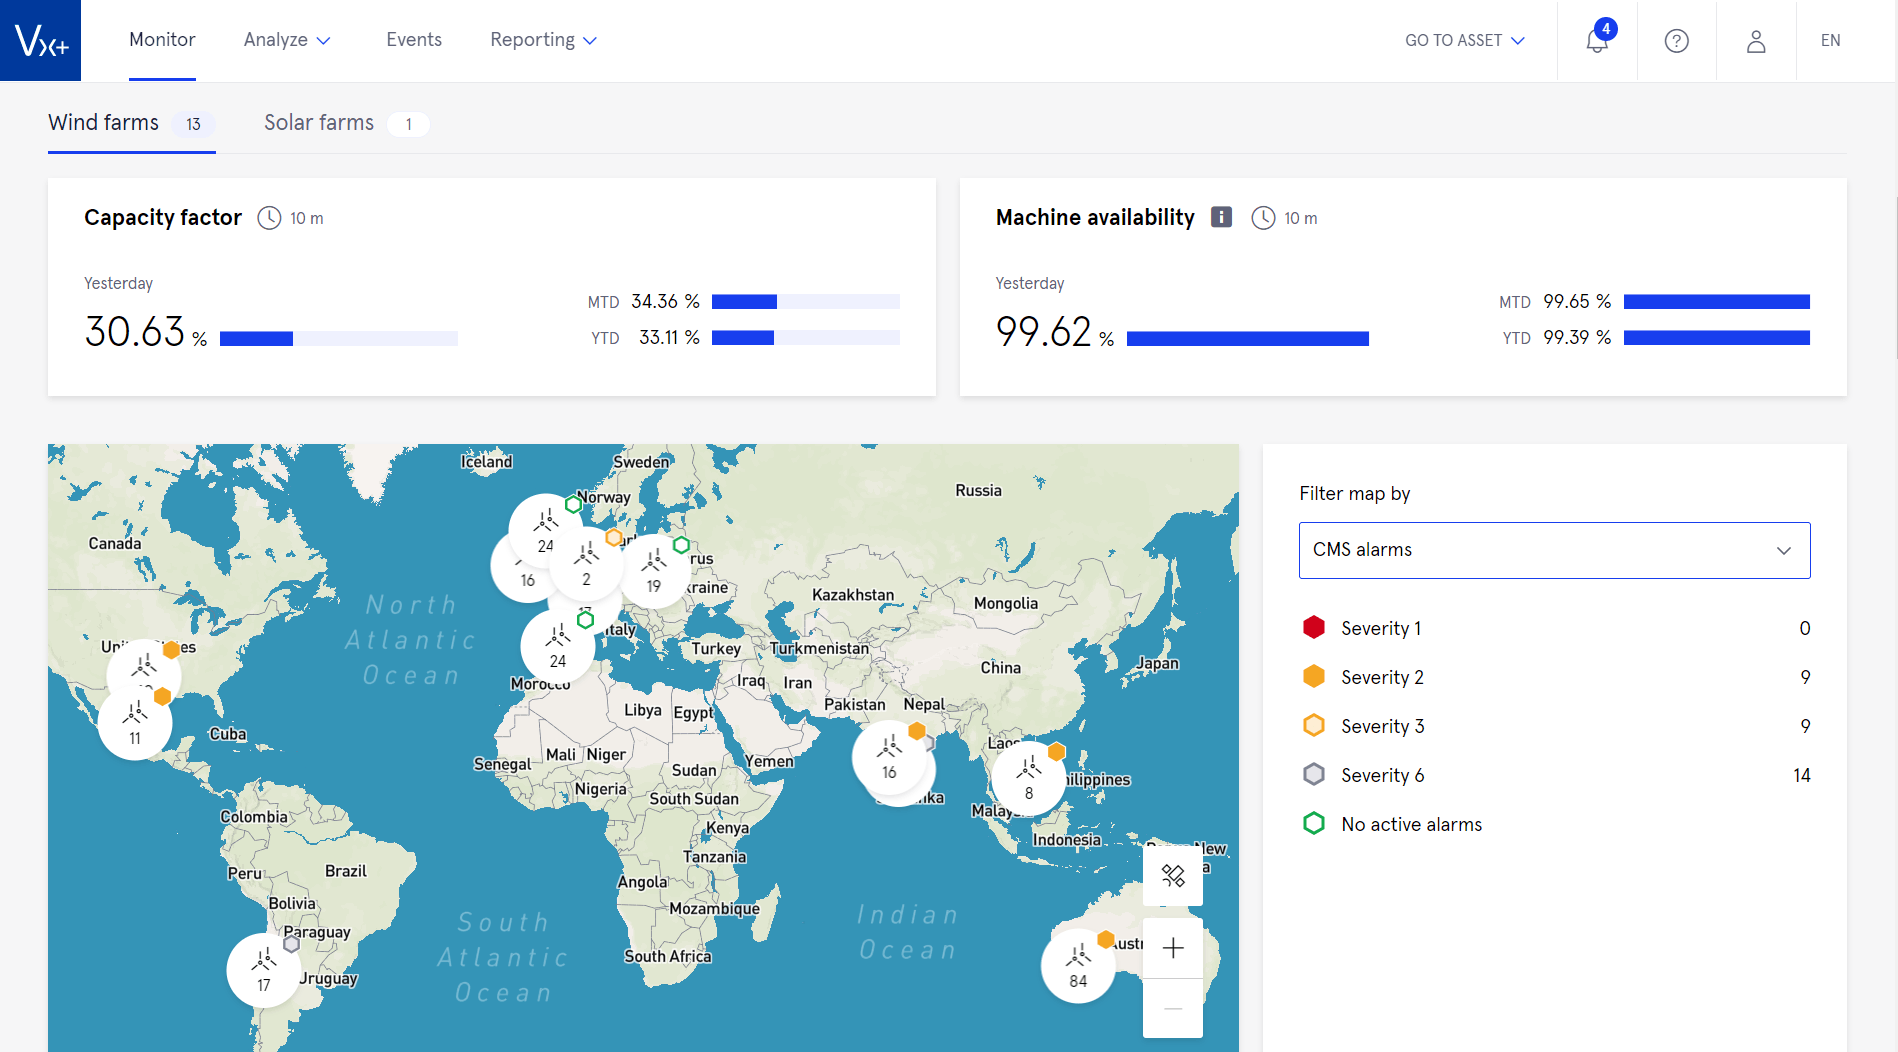
Access turbine data at a fleet, site, turbine, or component level. Any turbine brand, on any device
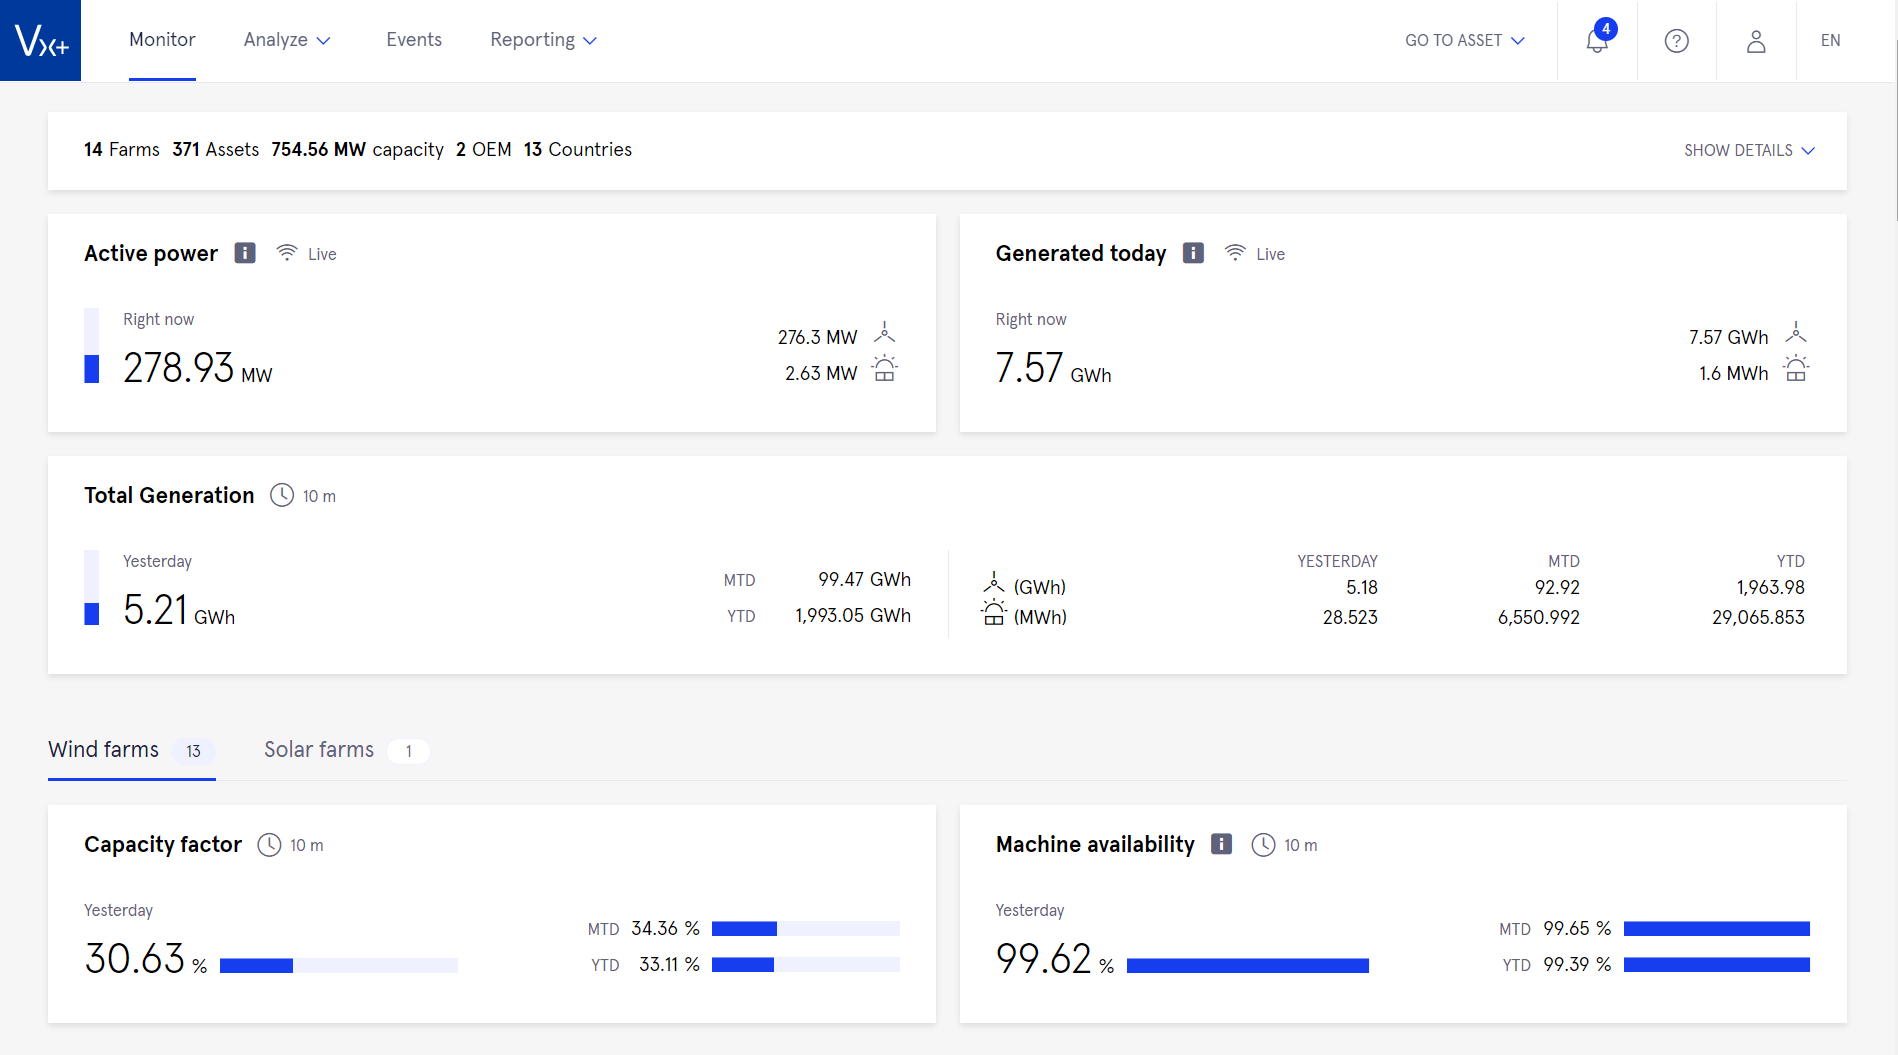
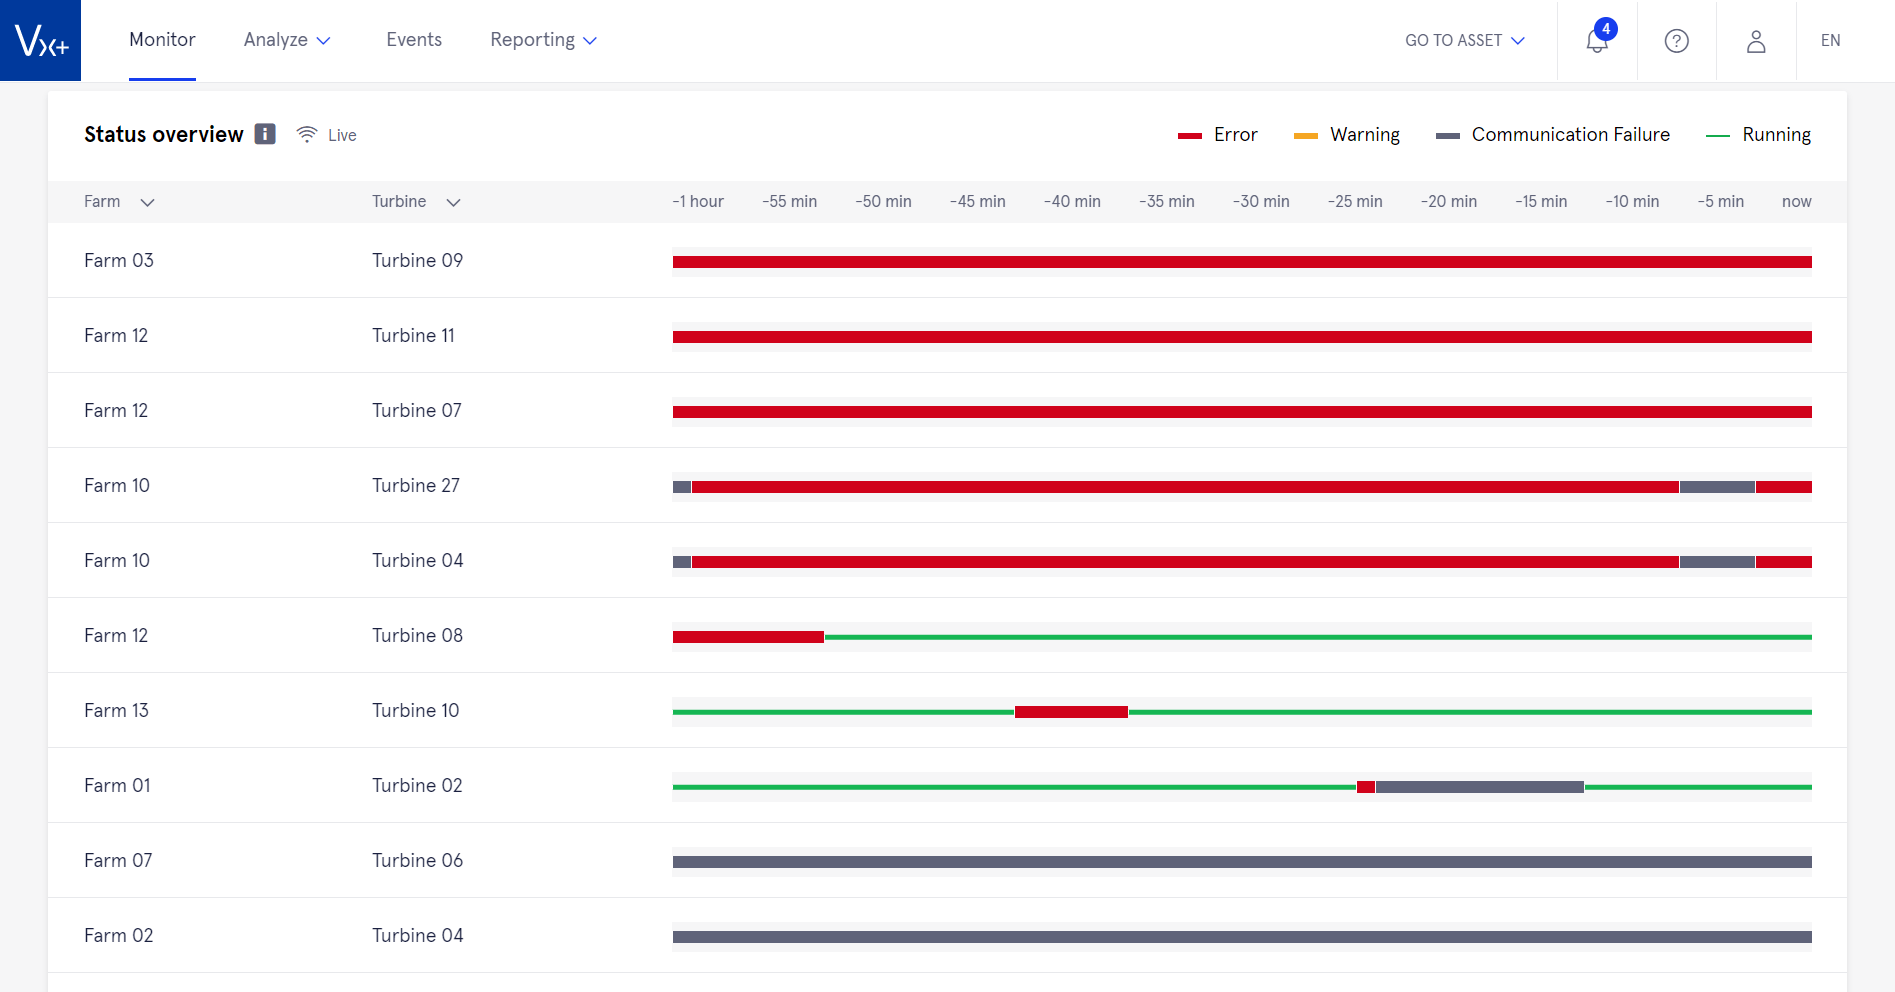
Monitor generation, availability, turbine events, and component metrics in real time; identify any issues and take relevant action.
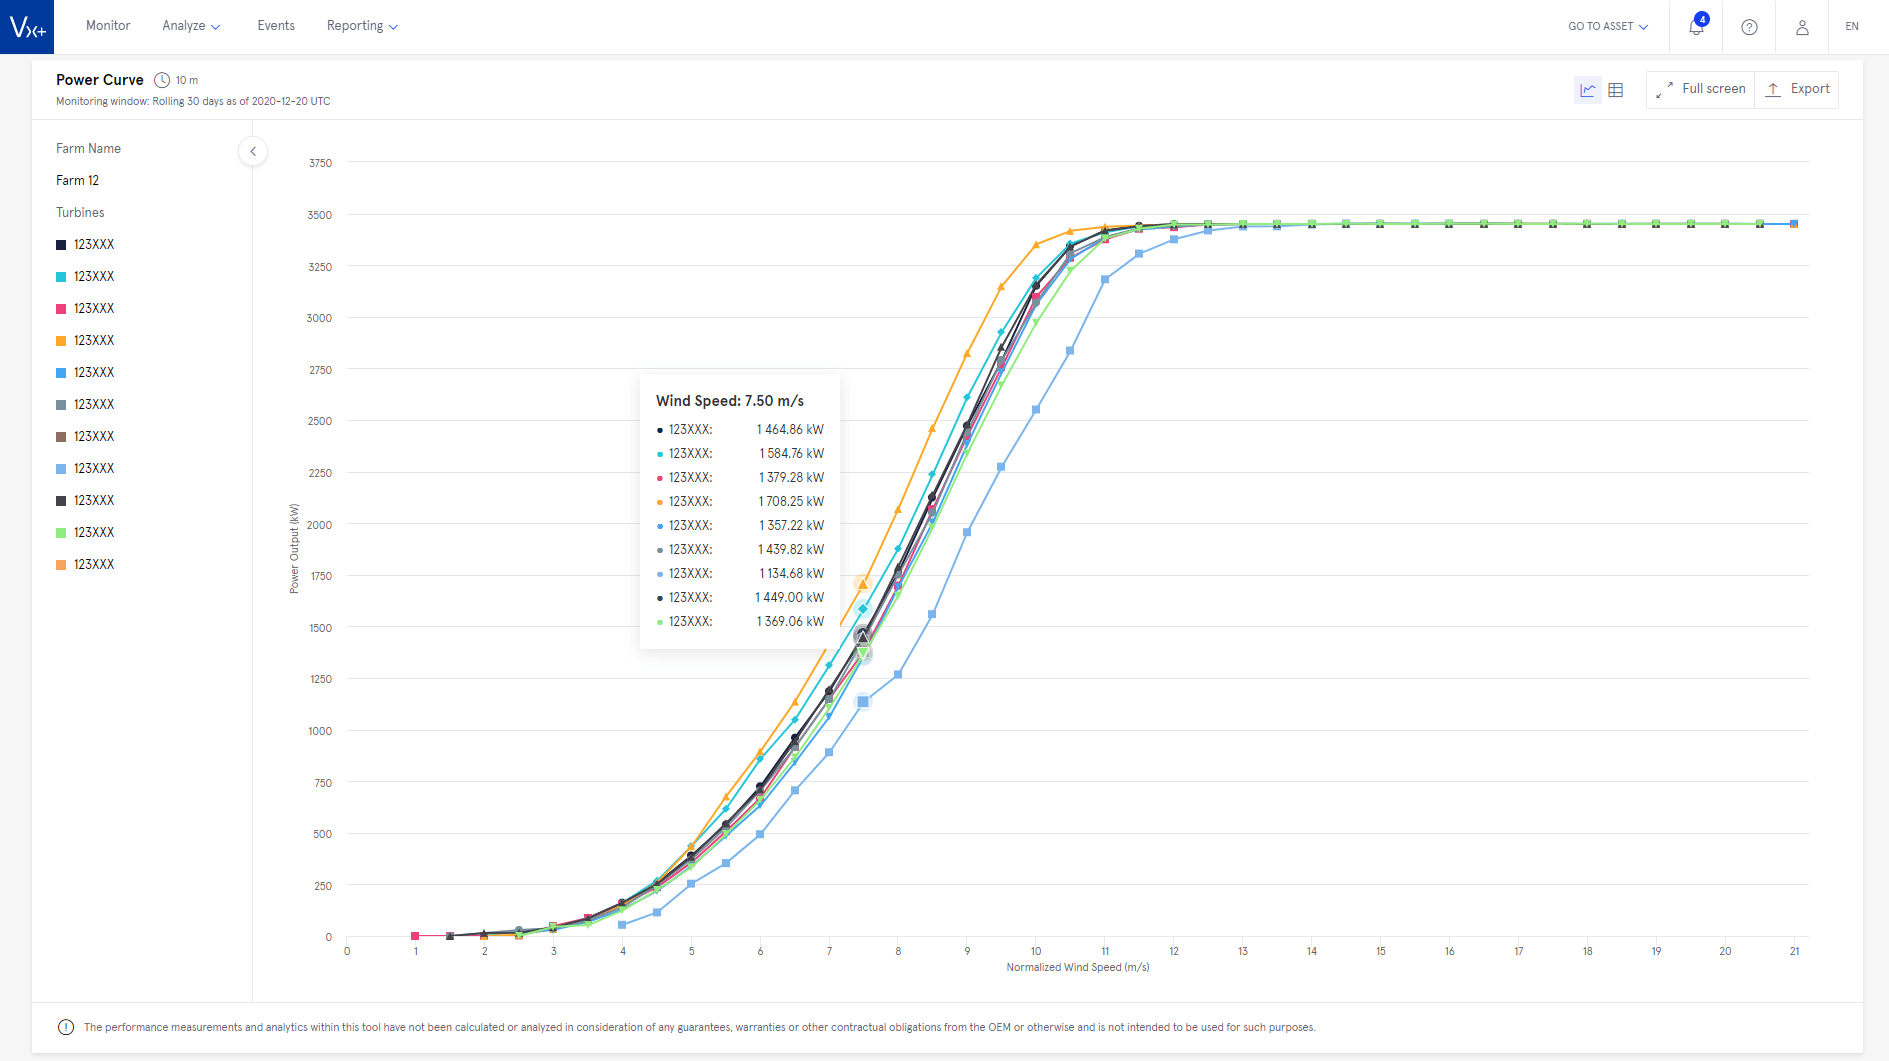
Power curve-based condition monitoring for early detection of shifts to minimize revenue loss
Integrated Analysis of CMS & SCADA; analyze the behavior of various parameters and detect possible issues before they happen
Create, view, edit, and delete budgets at the wind farm level or the individual turbine level
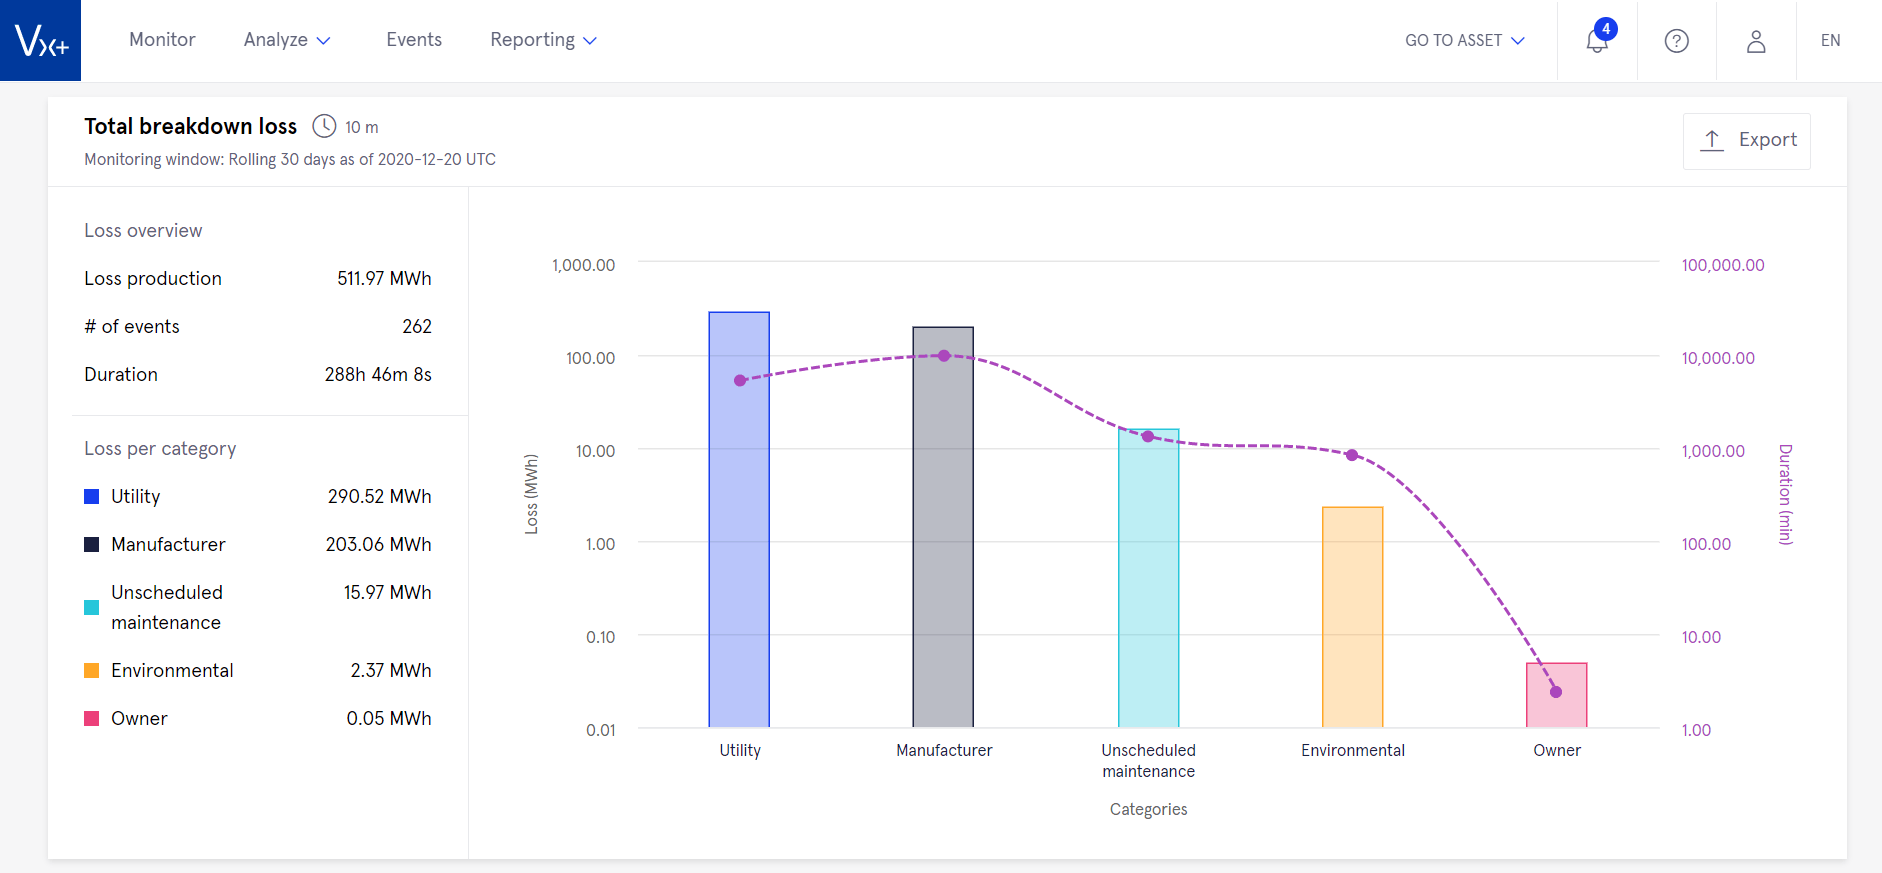
View production losses by categories: performance, breakdown, curtailment, derate, icing
Monitor and visualize grid data and alerts; take necessary actions to rectify any deviations from defined limits
Create, manage, and track work orders end-to-end, enabling action-based insights while keeping teams on the same page on work order status
NERC GADS Report: wind performance data for Generating Availability Data System (GADS)
Get timely alerts by email to take quick action to resolve any potential issues faster; reduce the amount of manual checking for different parameters
Custom dashboarding lets users define the dashboard they want to track and monitor; add and arrange metric widgets you care about most
Get recurring daily, weekly, monthly reports via email to get a 360-degree view of your portfolio, farm or turbine
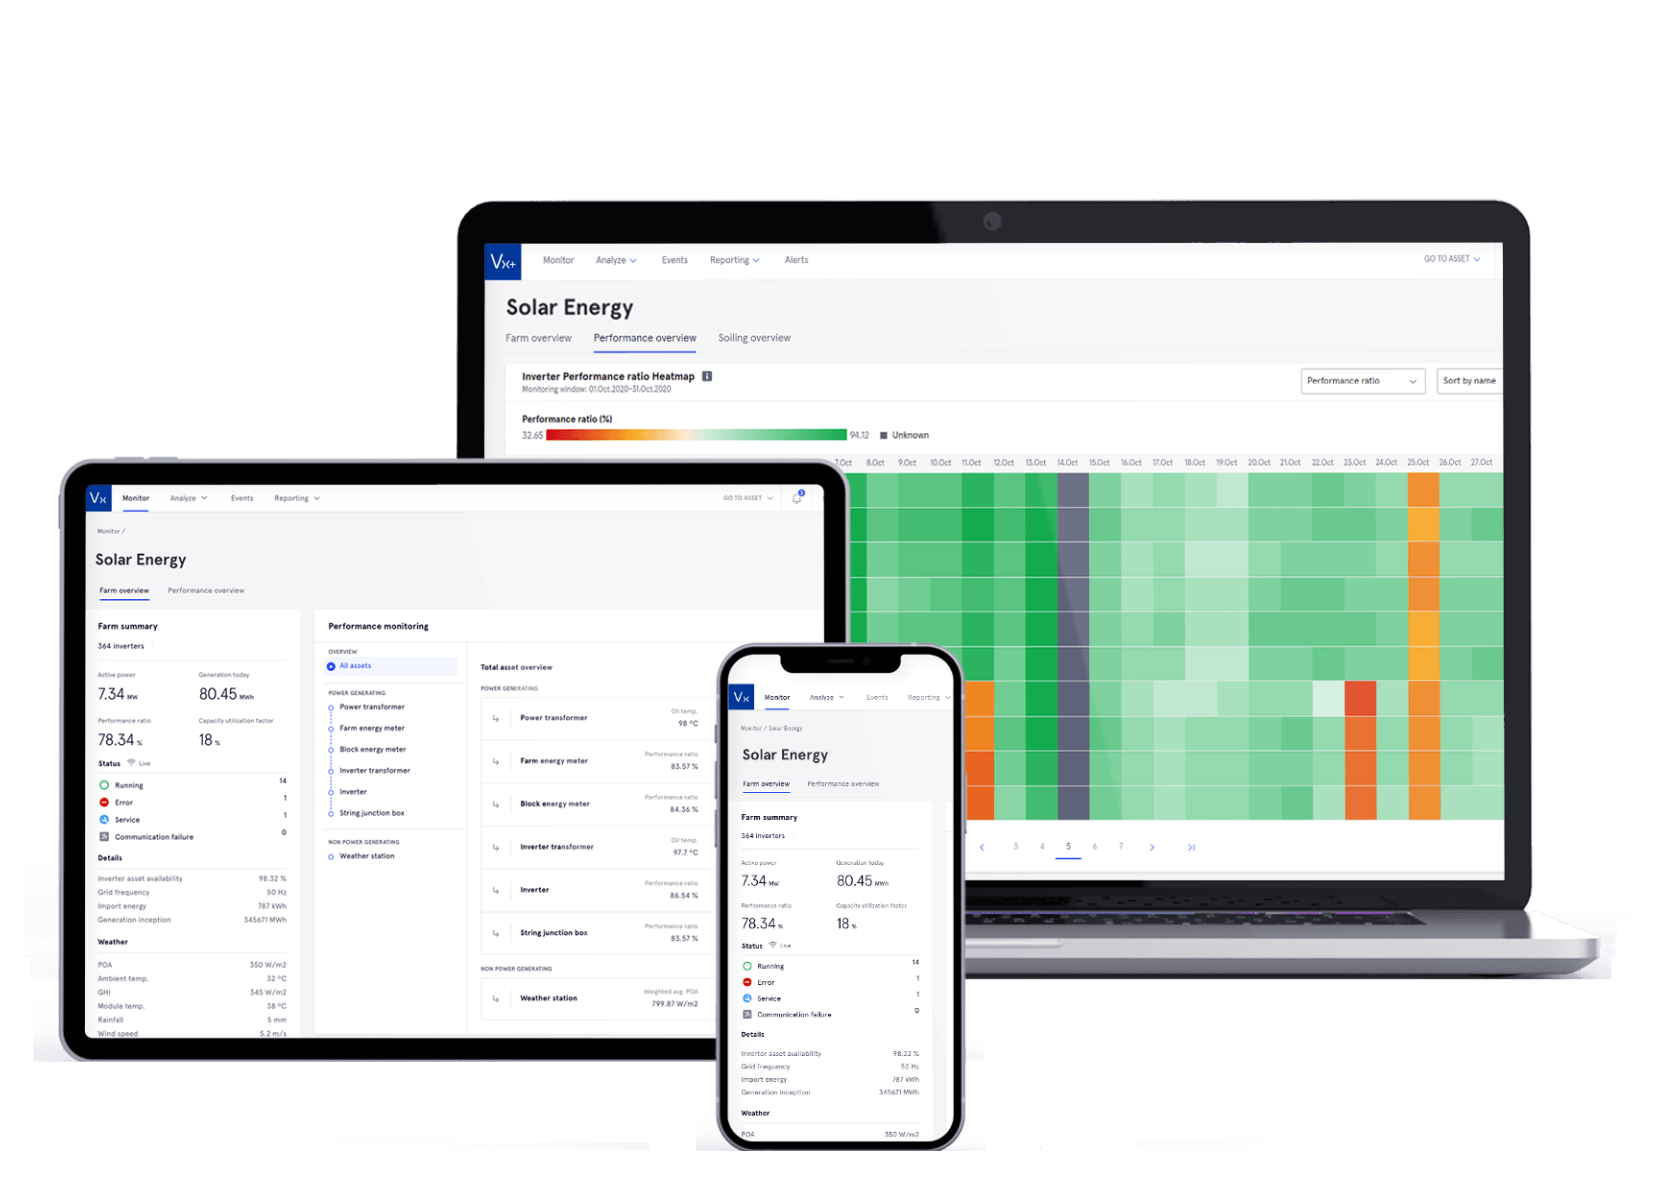
Scipher.Vx+ Solar module: Monitor all your wind and solar PV assets in one product.
- Dashboard view with KPI-friendly insights on inverter performance and downtime analytics such as breakdown events, frequency, and duration of events
- Detect real-time performance deviations of solar PV assets and rank based on user selected KPIs; visualize asset performance from good to bad
- Save on panel cleaning costs by proactively taking decisions from soiling rate data. View which inverters/zones are highly/moderately soiled